by: Hefei Institutes of Physical Science, CAS
Recently, Meng Guowen's research group, researcher of the Nanomaterials and Device Technology Research Department of the Institute of Solid State Physics, Hefei Research Institute, Chinese Academy of Sciences, studied the construction of three-dimensional flexible surface enhanced Raman scattering (SERS) substrate and its rapid and sensitive response to organic pollutants New progress has been made in this regard. The researchers used the in-situ growth method to prepare the Ag nanoparticle-modified bacterial cellulose flexible composite substrate, and used the volume shrinkage characteristics of bacterial cellulose to further increase the density of Ag particles and the SERS activity of the substrate, realizing a variety of toxic organic pollution Rapid detection of objects. The related research results are titled "Ag-Nanoparticles@Bacterial-Nanocellulose Composite as 3D Flexible and Robust Surface-Enhanced Raman Scattering Substrate" and published on ACS Applied Materials & Interfaces.
Compared with conventional pollutants, toxic organic pollutants have the characteristics of non-degradability, bioaccumulation, migration and high toxicity, which threaten human health and the ecological environment. Traditional chromatographic and mass spectrometry detection technologies require complex equipment and long detection cycles, making it difficult to achieve on-site rapid detection of toxic organic pollutants in the environment. SERS technology has a wide range of application prospects in the field of rapid detection of environmental pollutants because of its high sensitivity, fast response speed, fingerprint effect and other characteristics. The design and preparation of SERS substrates with high sensitivity and good signal repeatability is one of the key factors to realize the application of SERS detection technology. The organic pollutants in the environment, due to the complex detection environment, puts forward higher requirements on the stability and mechanical flexibility of the SERS substrate. Therefore, the development of flexible SERS substrates has become one of the research hotspots. At present, the reported preparation method of flexible SERS substrate is mainly to modify the pre-synthesized precious metal nanoparticles to the surface of the flexible material by dipping, filtering, etc., between the precious metal particles and the flexible material in the composite substrate prepared by this method The connection is weak and the load of precious metal particles is limited. In addition, the precious metal particles are easily detached from the flexible substrate during the detection process, resulting in poor stability and repeatability of the detection signal.
In view of this, the researchers used a three-dimensional network structure composed of bacterial nanocellulose as a flexible carrier, and used the silver mirror reaction to grow uniformly distributed Ag nanoparticles on its surface in situ to obtain a high-density Ag nanoparticle-modified bacterial cellulose flexible (Ag nano-particles@bacterial cellulose) composite substrate, and use the characteristic of volume shrinkage of bacterial cellulose when drying, further increase the density of Ag particles. This high-density Ag particles generate a large number of uniformly distributed high-activity SERS “hot spots”. Therefore, the prepared composite substrate exhibits ultra-high SERS sensitivity and good signal repeatability; hydrophilic bacterial cellulose has Good permeability and adsorption, can effectively capture the target molecule to the high SERS active area, thereby further improving the SERS detection sensitivity of the substrate; Ag nanoparticles grow in situ and firmly fixed on the three-dimensional bacterial cellulose frame, effective The shedding of silver nanoparticles is avoided. Therefore, the flexible substrate still exhibits good stability and high SERS sensitivity under different detection conditions such as bending and ultrasonic processing. The use of this Ag nanoparticle@bacterial cellulose composite substrate not only realizes the detection of the conventional probe molecule Rhodamine 6G, but also realizes the rapid detection of a variety of toxic organic pollutants (thiram, 2-naphthalenethiol) The detection limit was reduced to 3.8×10⁻⁹ M and 1.6×10⁻⁸ M. In addition, the detection signal intensity and concentration logarithm of thiram and 2-naphthylthiol all show a good linear relationship, indicating that the substrate has potential application prospects in the quantitative and rapid detection of toxic organic pollutants.
The research work is supported by the National Natural Science Foundation of China, the Key Frontier Science Research Project of the Chinese Academy of Sciences, and the Natural Science Foundation of Anhui Province.
Paper link:
https://pubs.acs.org/doi/10.1021/acsami.0c13828
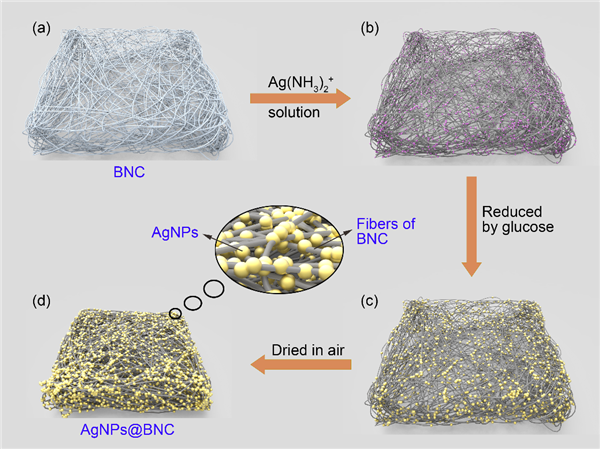
Figure 1. Flow chart of preparation of Ag nanoparticles@bacterial cellulose composite structure.
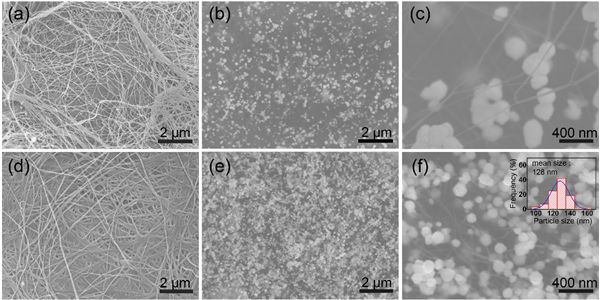
Figure 2. (a) SEM image of bacterial cellulose before volume shrinkage; (b) and (c) SEM images of Ag nanoparticles@bacterial cellulose composite structure before volume shrinkage at different magnifications; (d) after volume shrinkage SEM images of bacterial cellulose; (e) and (f) SEM images of Ag nanoparticles@bacterial cellulose composite structure after volume shrinkage. The inset in (f) is the size distribution of Ag nanoparticles.
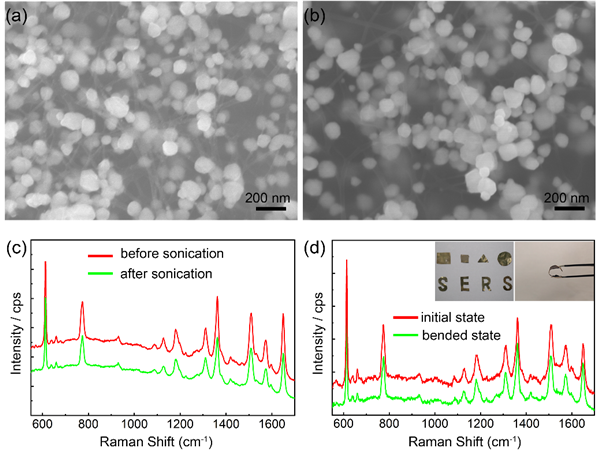
Figure 3. (a) and (b) SEM images of Ag nanoparticles@bacterial cellulose substrate before and after ultrasound; (c) SERS spectra of Ag nanoparticles@bacterial cellulose substrate before and after ultrasound for R6G; (d) ) The SERS spectrum of Ag nanoparticles@菌cellulose substrate on 10-7 M R6G in the initial and curved state, where the inset in (d) is the Ag nanoparticles in the curved state and cut into different shapes@菌cellulose Lining Bottom optical photo.
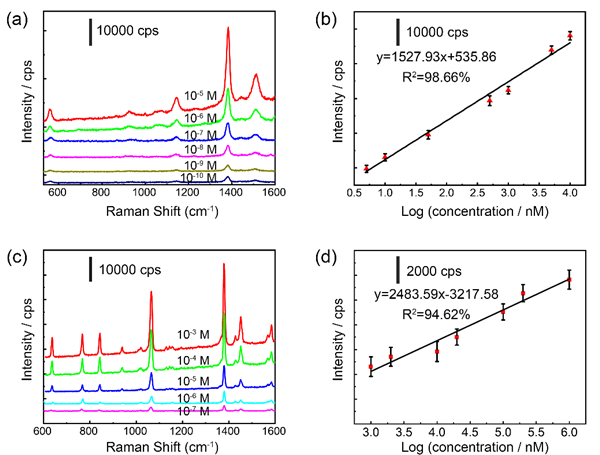
Figure 4. (a) Thiram SERS signal at a concentration of 10-5-10-10 M; (b) A linear fitting graph between the intensity of the characteristic peak of Thiram at 1382 cm-1 and the logarithm of the concentration; (c ) SERS signal of 2-naphthylthiol at different concentrations of 10-3-10-7 M; (d) The linear fitting graph between the characteristic peak intensity of 2-naphthylthiol at 1380 cm-1 and the logarithm of the concentration.
Source: http://www.cas.cn/syky/202012/t20201216_4771032.shtml
Disclaimer: This article is translated by cpolymer. The translation is for reference only. All contents are subject to the original text.